
Trade Study Instructions
This page outlines the general use of the Trade Study tool.
What is a Trade Study?
A trade study is a method for making a complex decision between competing alternatives. Trade studies are most useful when there are many different criteria that need to be considered in the decision, each of which has a different importance. For example, when selecting a car you may care about safety, fuel economy, and cost, and each of those factors probably has a different level of importance.
More details on what a trade study is and the methods and calculations involved can be found here.
Inputs
Three major categories of inputs are entered:
- Alternatives
- Criteria
- Performance
In the alternatives section you list the alternatives that you are deciding between. In the criteria section you list the criteria that are considered in making the decision. In the performance section you rate each alternative for how well it performs for each criteria.
The use of this trade study tool will be described through the completion of an example. In the example, Fred and Betty are deciding on a new car for their family. They are middle-age professionals with two children, Jimmy and Jill.
Alternatives
There are several cars that Fred and Betty are deciding between:
- Toyota Camry
- Ford Explorer
- Ford F150
- Porche Boxter
Fred has his eye on the Porche Boxter, but Betty is the voice of reason and insists that it isn't appropriate for the family. She will drive the point home with a well documented trade study.
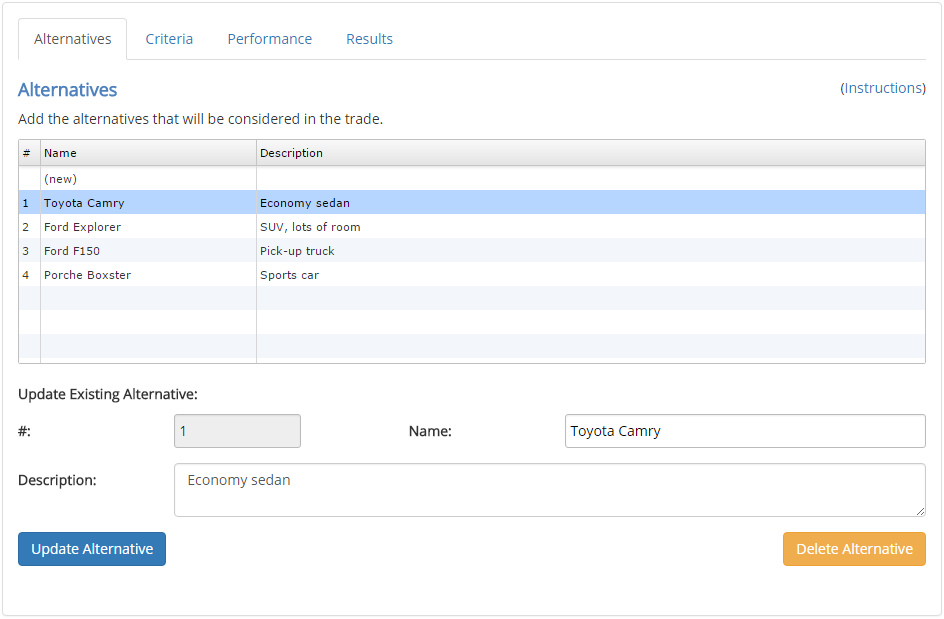
The alternatives under consideration are entered into the Alternatives tab, as shown below. Each alternative is shown in the table. A new alternative can be added by clicking on the "new" row at the top of the table, entering the information for the alternative into the text fields below the table, and then clicking on the "Add Alternative" button. An alternative can be updated by selecting it in the table, updating the values in the fields below the table, and then clicking the "Update Alternative" button. An alternative can be deleted by selecting it in the table and clicking the "Delete Alternative" button.
Criteria
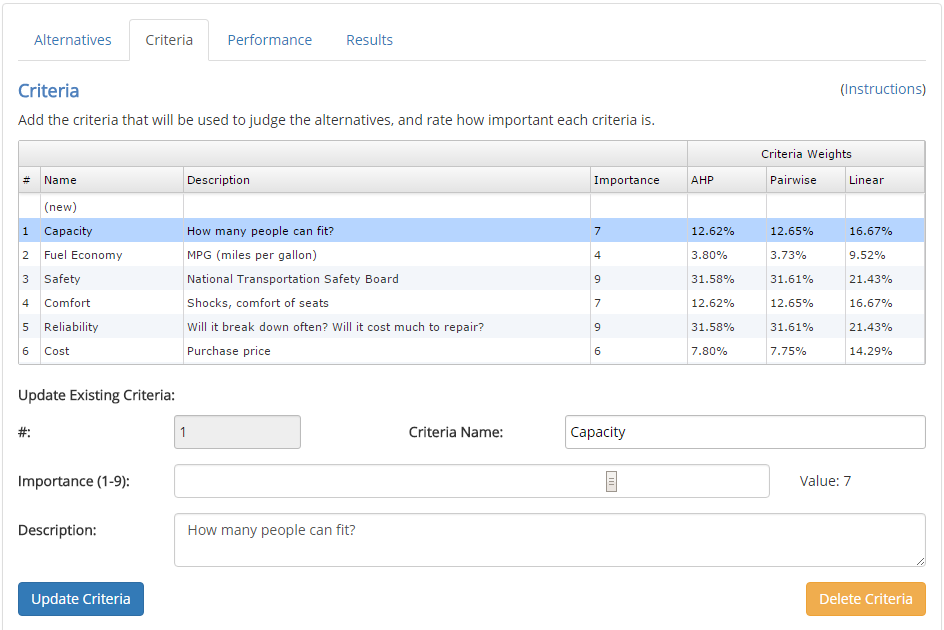
The criteria that Fred and Betty are using to make their decision are shown below. Since they have two children, it is important that the car be safe and able to fit all four of them comfortably. Since Fred and Betty are busy all day either at work or chasing their two children around, they can't afford to spend much time wrangling with auto repairs, so the car must be reliable.
A new criteria can be added by clicking on the "new" row at the top of the table, entering the information for the criteria into the fields, and then clicking on the "Add Criteria" button. The importance of a criteria is rated on a scale of 1 to 9, with 1 being the lowest importance and 9 being the highest. This importance value will then be used to calculate a criteria weight. There are three weighting methods used: Analytic Hierarchy Process (AHP), Pairwise, and Linear. These methods are described in detail in the reference section.
A criteria can be updated by selecting it in the table, updating the values in the fields below the table, and then clicking the "Update Criteria" button. A criteria can be deleted by selecting it in the table and clicking the "Delete Criteria" button.
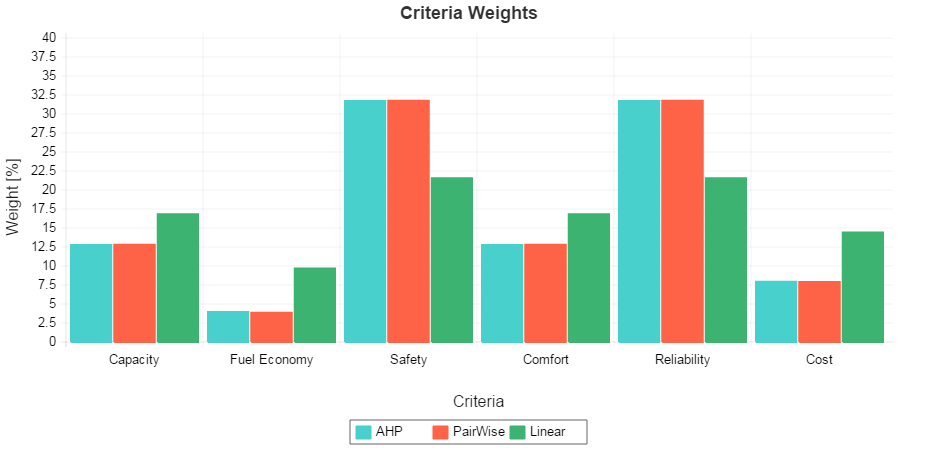
A chart of the criteria weights is shown in this tab, as seen below. The weighting value of each criteria is shown for each of the three weighting methods.
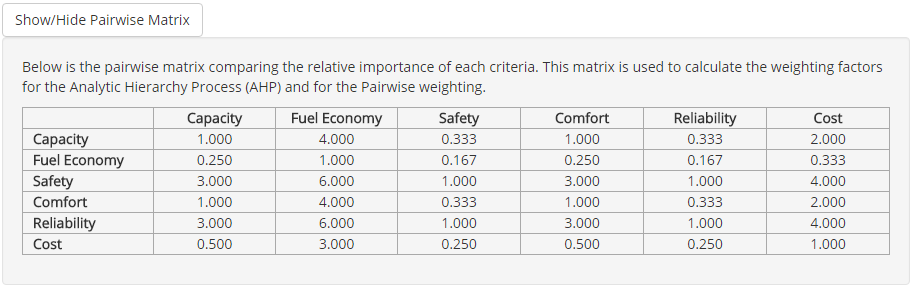
The pairwise matrix that is used to calculate the AHP and Pairwise weighting factors can be seen by clicking on the "Show/Hide Pairwise Matrix" button. More details on the construction and use of this matrix are given in the reference section.
Performance
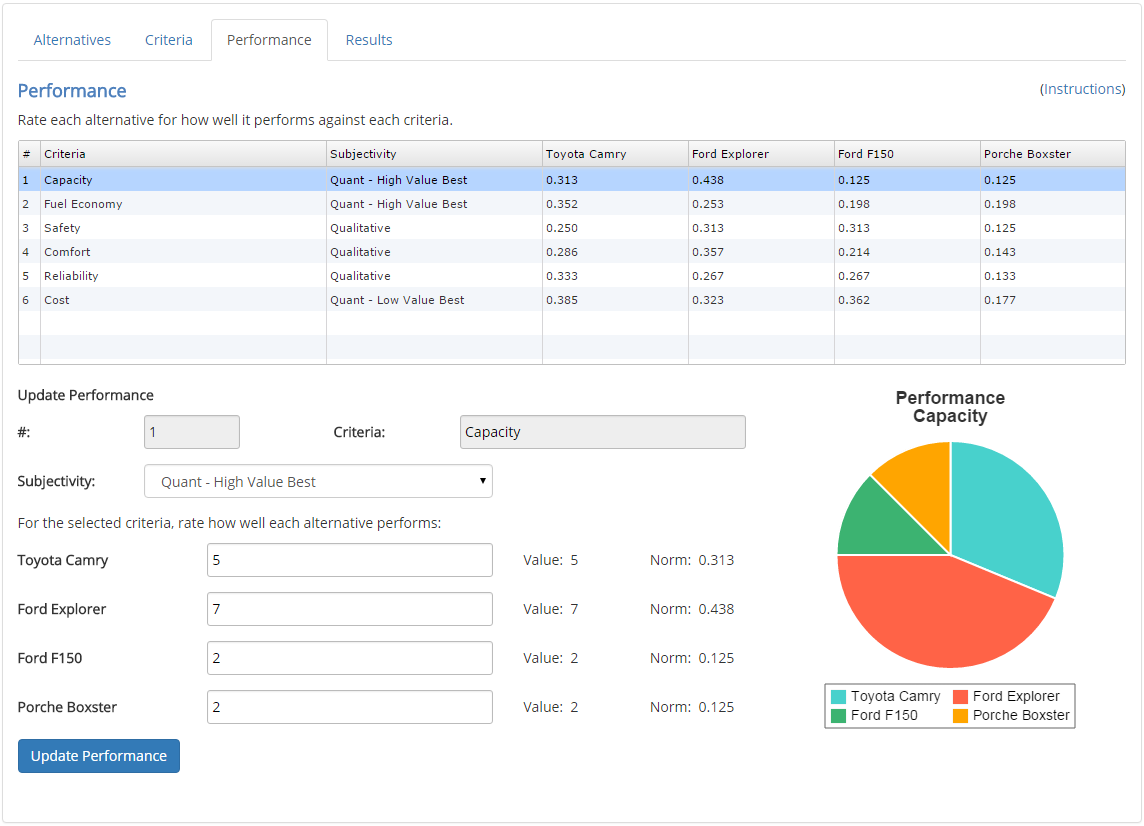
In this section, each of the alternatives are rated for how well they perform against each criteria. Complete this section by selecting each criteria in the table, and rating each of the alternatives for that criteria, and clicking "Update Performance" to save the ratings for the selected criteria.
When rating the alternatives, a subjectivity should be selected first, indicating whether an actual numerical value is known for each of the performance values or if the value is actually subjective (i.e. poor, good, excellent, etc.). The possible subjectivity selections are:
| • | Qualitative: | In this case numerical values for the performance are not known, and only a general subjective feel for how well each alternative performs is known. If this is selected, then each of the alternatives will be rated by selecting one of the following values from a drop-down: 1 - Very Poor, 2 - Poor, 3 - Fair, 4 - Good, 5 - Excellent. |
| • | Quantitative - High Value Best: | In this case numerical values are known for the performance, and a high value is best (i.e. for capacity, a higher value is best). |
| • | Quantitative - Low Value Best: | In this case numerical values are known for the performance, and a low value is best (i.e. for cost, a lower value is best). |
Once the values for the alternatives are set for a specific criteria, those values are normalized so that they sum to 1. The normalized values are shown in the table and are used for calculating results.
Results
Once the tabs for the alternatives, criteria, and performance are filled out, the results are shown in the Results tab. The results are summarized in the table and chart at the top of the tab, as shown below. The weighting method can be changed to see what effect the weighting method has on the final results.
Based on these results, the Ford Explorer and the Toyota Camry are both strong contenders, and the Porche Boxter is very clearly out of the race (sorry, Fred).
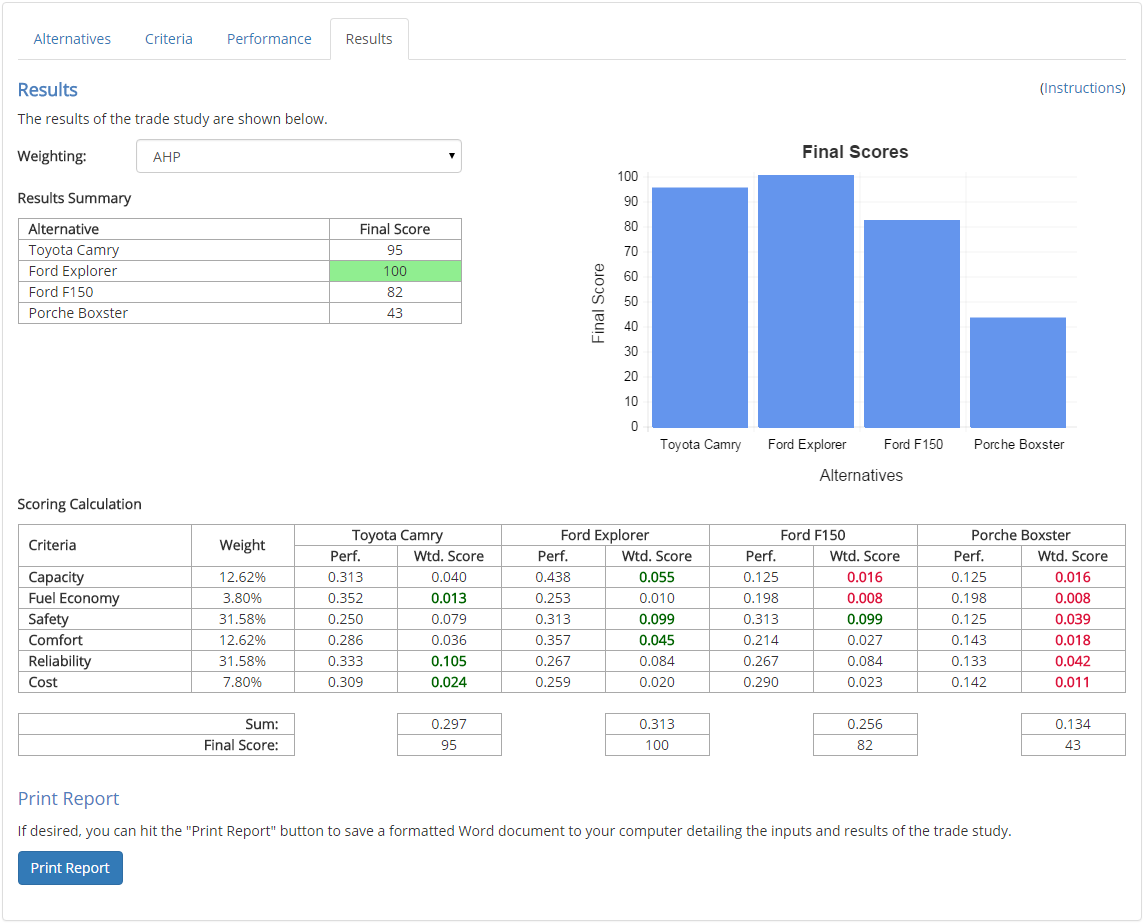
The calculations are shown in the table at the bottom of the tab. The calculations are performed by taking the performance of each alternative for each criteria and multiplying the performance value by the criteria weighting. The weighted scores are summed for each alternative and then scaled so the highest scoring alternative has a score of 100. The cells with bold green text indicate that the alternative received the highest weighted score for that criteria. Likewise, the cells with bold red text indicate that the alternative received the lowest weighted score for that criteria.
More details on calculating results are given in the reference section.
Interpreting Results
It should be noted that a trade study is only as objective as you make it. Any biases that you have when setting weightings for the criteria or when rating the performance of the alternatives will be reflected in the results, so the results of the trade study should not be taken as absolute. To minimize the risk of bias in the results, a sensitivity study should be conducted in which the criteria weightings and the performance values are modified to see how sensitive the results are to these factors.