Trade Study
A trade study, also known as a trade-off analysis, is a method for making a decision between competing alternatives. Although informal trade studies are performed frequently by simply weighing alternatives mentally and making a decision, formal trade studies are helpful in refining and solidifying thoughts and in removing bias from the decision. Trade studies are most useful when there are many different criteria that need to be considered in the decision, each of which has a different level of importance. For example, when selecting a car you may care about safety, fuel economy, and cost, but the importance of each of those factors is likely not the same.
Trade studies are an important tool within systems engineering, but they can be used for making decisions in a broad array of situations and so are useful outside of the narrow context of systems engineering. The primary steps of a formal trade study are:
- Identify alternatives
- Select criteria
- Assign criteria weights
- Rate performance
- Calculate results
There is a trade study tool on this site that helps to automate the process of performing a trade study. You may find it helpful to use this tool to follow along with the discussion.
Identify Alternatives
The first step in any trade study is to identify the alternatives that are being considered. For instance, you may need to decide between several potential vehicles: a Toyota Camry, Ford Explorer, Ford F150, and a Porsche Boxster. Each of these vehicles has its own merits, and the outcome of the trade study will be based on the attributes of the vehicle that are most important to you combined with how well each of the vehicles satisfies those attributes.
Select Criteria
After identifying the alternatives, the next step is to select the criteria that will be used when making the decision. The criteria define the critical attributes that the ideal alternative must possess. For example, if you are looking for a family vehicle to take your children to soccer practice then you may require it to be safe and to have enough space to fit your children and their soccer teammates. However, if you are looking for something to drag race on the weekends then speed and handling will be more important to you.
While the criteria will be unique for every decision, common criteria that are included in most trade studies include:
- Safety
- Reliability
- Maintainability
- Cost
When selecting criteria, it is important for the list of criteria to be complete (i.e. the list accounts for all of the critical attributes that should factor into the decision) and to be unique (i.e. the criteria are not dependent on one another such that performing well on one criteria means also performing well on another, and vice versa).
Need a Trade Study Tool?
Try our trade study tool based on the methodology described here.
- Easily specify alternatives, select criteria, and rate performance.
- Quickly and painlessly calculate trade study results.
Assign Criteria Weights
Once the complete list of criteria is determined, the weighting factors of each criteria are assigned based on the relative importance of each criteria. The weights determine how heavily a criteria contributes to the overall score. There are several common methods for determining weighting factors which are described below in order of simplest to most complicated.
Linear Weighting
By far the simplest method of calculating weighting factors is to use a linear weighting method. In this method, an importance value is assigned to each criteria on some scale -- for example, a scale of 1 through 9, where 1 is least important and 9 is most important. After the importance values are assigned, the values are normalized so that they sum to a value of 1, and these normalized values become the weighting factors.
Pairwise Weighting
The pairwise weighting method consists of creating a square matrix where the criteria are placed along the rows and columns of the matrix. The values in the matrix are based on the relative importance between pairs of criteria. The values are chosen within the range 1-9 as described by the following table:
| Value | Description |
|---|---|
| 1 | Equal importance |
| 3 | Moderately more important |
| 5 | Strongly more important |
| 7 | Very strongly more important |
| 9 | Extremely strongly more important |
| 2, 4, 6, 8 | Intermediate values |
The values are filled into the matrix by comparing the criteria in each row to the criteria along the columns and determining the relative importance between the criteria. An example matrix is given below for the case of selecting a family car. In this example, safety and reliability are the most important criteria. This can be seen by finding the rows for safety and reliability and noting that the values for these criteria are always greater than or equal to 1. For instance, safety is moderately more important than comfort (3) and is much more important than fuel economy (6). If you look at the row for comfort, you will see that the value when compared to safety is 1/3, which is consistent. Likewise, in the row for fuel economy, the value when compared with safety is 1/6.
| Capacity | Fuel Economy | Safety | Comfort | Reliability | Cost | |
|---|---|---|---|---|---|---|
| Capacity | 1 | 4 | 1/3 | 1 | 1/3 | 2 |
| Fuel Economy | 1/4 | 1 | 1/6 | 1/4 | 1/6 | 1/3 |
| Safety | 3 | 6 | 1 | 3 | 1 | 4 |
| Comfort | 1 | 4 | 1/3 | 1 | 1/3 | 2 |
| Reliability | 3 | 6 | 1 | 3 | 1 | 4 |
| Cost | 1/2 | 3 | 1/4 | 1/2 | 1/4 | 1 |
Once the pairwise matrix is constructed, the weighting factors can be calculated. The calculation is performed by finding the geometric mean of each row in the matrix and then normalizing the geometric mean values. A geometric mean is calculated by:
The table below shows the matrix along with the geometric mean values for each row and the final normalized weighting factors:
| Capacity | Fuel Econ | Safety | Comfort | Reliability | Cost | Geometric Mean | Normalized Weight | ||
|---|---|---|---|---|---|---|---|---|---|
| Capacity | 1 | 4 | 1/3 | 1 | 1/3 | 2 | 0.9806 | 0.1265 | |
| Fuel Economy | 1/4 | 1 | 1/6 | 1/4 | 1/6 | 1/3 | 0.2887 | 0.0373 | |
| Safety | 3 | 6 | 1 | 3 | 1 | 4 | 2.4495 | 0.3161 | |
| Comfort | 1 | 4 | 1/3 | 1 | 1/3 | 2 | 0.9806 | 0.1265 | |
| Reliability | 3 | 6 | 1 | 3 | 1 | 4 | 2.4495 | 0.3161 | |
| Cost | 1/2 | 3 | 1/4 | 1/2 | 1/4 | 1 | 0.6005 | 0.0775 | |
| Sum: | 7.7492 | 1.0000 | |||||||
Analytic Hierarchy Process
The Analytic Hierarchy Process (AHP) begins by constructing the pairwise matrix as described in the previous section. However, instead of determining the weighting factors by calculating the geometric mean for each row, the matrix is multiplied by itself and then each row of the resulting matrix is summed and normalized. The matrix multiplication is performed until the normalized values converge. In this process, the resulting matrix from each multiplication is multiplied by itself for the next iteration. Although convergence can be tested, it is typically safe to just perform the multiplication 3 times. Once the final matrix is attained, the rows of the matrix are summed to obtain a column of values. This column of summed row values is then be normalized to give the final weighting factors.
The weighting factors that result from AHP are typically very similar to the weighting factors that result from the pairwise method. For example, the weighting factors in the table below were calculated with the AHP method using the same pairwise matrix from the previous section:
| Normalized Weight | |
|---|---|
| Capacity | 0.1262 |
| Fuel Economy | 0.0380 |
| Safety | 0.3158 |
| Comfort | 0.1262 |
| Reliability | 0.3158 |
| Cost | 0.0780 |
Need a Trade Study Tool?
Try our trade study tool based on the methodology described here.
- Easily specify alternatives, select criteria, and rate performance.
- Quickly and painlessly calculate trade study results.
Rate Performance
After the criteria have been selected, the performance values of the alternatives are rated. The rating is based on how well the alternative meets the criteria. In every case, a rating value is assigned to each criteria, and then the values are normalized.
Several examples will be demonstrated for the case of buying a family car using the criteria from the previous section.
Qualitative Performance
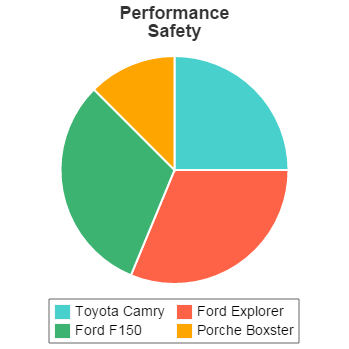
For a criteria such as safety, a numerical value may not be known, and instead only a general qualitative feel for how well each alternative performs is known. In this case, a rating value can be assigned to the alternative based on a scale of 1-5, where 1 is very poor and 5 is excellent.
An example of the performance ratings for several vehicles is given in the table below, where the values are based on qualitative ratings on a scale of 1-5. The values are then normalized to give the final performance scores:
Safety
| Value | Normalized Value | |
|---|---|---|
| Toyota Camry | 4 | 0.25 |
| Ford Explorer | 5 | 0.313 |
| Ford F150 | 5 | 0.313 |
| Porsche Boxster | 2 | 0.125 |
Quantitative Performance - High Value Best
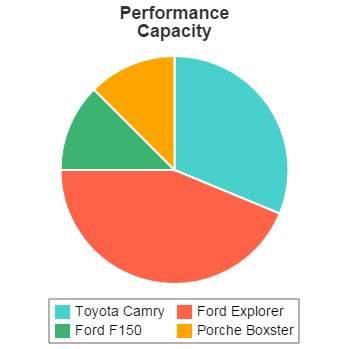
Very commonly, a numerical value is known for the performance, and a higher value is better than a low value. In this case, the actual performance value can be used directly, and then the values are normalized to give the final performance scores. An example for passenger capacity is shown below, where the value is simply the number of passengers that can fit in the vehicle:
Passenger Capacity
| Value | Normalized Value | |
|---|---|---|
| Toyota Camry | 5 | 0.313 |
| Ford Explorer | 7 | 0.438 |
| Ford F150 | 2 | 0.125 |
| Porsche Boxster | 2 | 0.125 |
Quantitative Performance - Low Value Best
If a numerical value is known for the performance but a low value is best instead of a high value, then the performance values are recorded and an intermediate reversed value is calculated based on:
For the reversed value, the actual value is the same distance below the maximum value as the actual value was originally above the minimum value. The reversed values are then normalized to give the final performance scores.
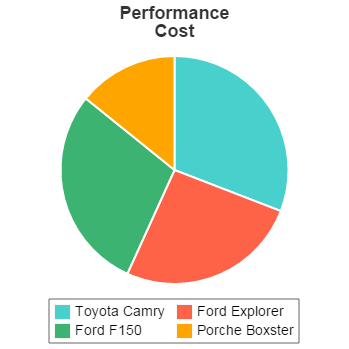
An example for vehicle cost is shown below:
Cost
| Value | Reversed Value | Normalized Value | |
|---|---|---|---|
| Toyota Camry | $23,000 | $50,000 | 0.309 |
| Ford Explorer | $31,000 | $42,000 | 0.259 |
| Ford F150 | $26,000 | $47,000 | 0.290 |
| Porsche Boxster | $50,000 | $23,000 | 0.142 |
Calculate Results
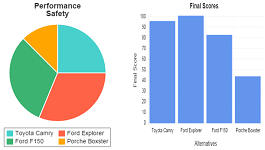
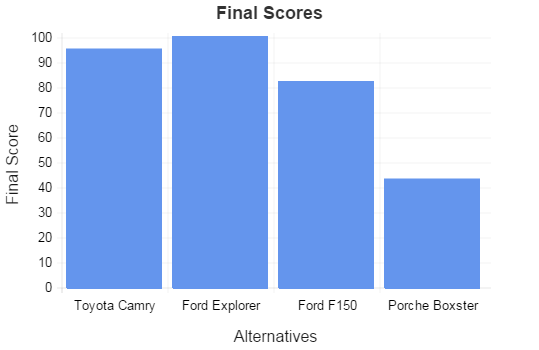
To calculate the results, a table is constructed like the one shown below. The criteria are listed down the rows together with the weighting factor for each criteria, and the alternatives are listed across the columns. The performance scores are listed for each alternative with respect to each criteria. A weighted score is then calculated by multiplying the performance score by the weighting factor for the corresponding criteria. The weighted scores are then summed for each alternative, and a final score is calculated by scaling the summed weighted scores so that the highest scoring alternative has a score of 100.
| Criteria | Weight | Toyota Camry | Ford Explorer | Ford F150 | Porsche Boxster | ||||
|---|---|---|---|---|---|---|---|---|---|
| Perf. | Wtd. Score | Perf. | Wtd. Score | Perf. | Wtd. Score | Perf. | Wtd. Score | ||
| Capacity | 12.62% | 0.313 | 0.040 | 0.438 | 0.055 | 0.125 | 0.016 | 0.125 | 0.016 |
| Fuel Economy | 3.80% | 0.352 | 0.013 | 0.253 | 0.010 | 0.198 | 0.008 | 0.198 | 0.008 |
| Safety | 31.58% | 0.250 | 0.079 | 0.313 | 0.099 | 0.313 | 0.099 | 0.125 | 0.039 |
| Comfort | 12.62% | 0.286 | 0.036 | 0.357 | 0.045 | 0.214 | 0.027 | 0.143 | 0.018 |
| Reliability | 31.58% | 0.333 | 0.105 | 0.267 | 0.084 | 0.267 | 0.084 | 0.133 | 0.042 |
| Cost | 7.80% | 0.309 | 0.024 | 0.259 | 0.020 | 0.290 | 0.023 | 0.142 | 0.011 |
| Sum: | 0.297 | 0.313 | 0.256 | 0.134 | |||||
| Final Score: | 95 | 100 | 82 | 43 | |||||
Interpreting Results
A trade study is only as objective as you make it. Any biases that you have when setting weightings for the criteria or when rating the performance of the alternatives will be reflected in the results, so the results of the trade study should not be taken as absolute. To minimize the risk of bias in the results, a sensitivity study should be conducted in which the criteria weightings and the performance values are modified to see how sensitive the results are to these factors.
PDH Classroom offers a continuing education course based on this trade studies reference page. This course can be used to fulfill PDH credit requirements for maintaining your PE license.
Now that you've read this reference page, earn credit for it!
