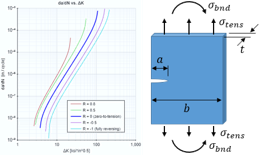
Fatigue Crack Growth
Contents
Introduction
Cracks commonly occur in engineered parts and can significantly reduce their ability to withstand load. Cracks typically form around pre-existing flaws in a part. They usually start off small and then grow during operational use.
A crack in a part will grow under conditions of cyclic applied loading, or under a steady load in a hostile chemical environment. Crack growth due to cyclic loading is called fatigue crack growth and is the focus of this page. Crack growth in a hostile environment is called environmental crack growth and is not discussed here.
The analysis of fatigue crack growth relies on the concepts of fracture mechanics which are discussed on this page. If you are not familiar with fracture mechanics, it is recommended that you read that page before proceeding.
Crack Size vs. Cycles
A typical plot showing the growth of a crack is provided below. The crack size, a, is shown as a function of cycles, N, of applied load. The rate of crack growth is da/dN and is the instantaneous slope of the crack growth curve.
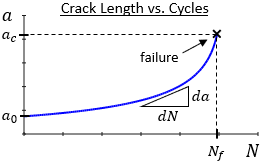
Notice that the crack initially grows very slowly, but the growth accelerates (i.e., da/dN increases) as the crack size increases. The reason for this acceleration in growth is that the growth rate is dependent on the stress intensity factor at the crack tip, and the stress intensity factor is dependent on the crack size, a. As the crack grows the stress intensity factor increases, leading to faster growth. The crack grows until it reaches a critical size and failure occurs.
Definitions for Applied Loading
The figure below shows stresses applied in a cyclic manner. For simplicity, the figure shows constant values of maximum and minimum stresses; however, the loading in a realistic scenario may be much less uniform and may consist of multiple sets of stress ranges.
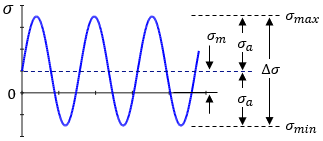
In the figure, σmax is the maximum value of applied stress, σmin is the minimum value of applied stress, σm is the mean stress, σa is the stress amplitude, and Δσ is the stress range.
| Mean stress: |
|
| Stress amplitude: |
|
| Stress range: | Δσ = σmax − σmin |
The stress ratio is an important quantity, and is the ratio of the minimum stress to the maximum stress:
The stress ratio R is commonly called the R-ratio.
Recall that the stress intensity factor is a function of geometry and applied stress:
where σ is the applied stress, a is the crack size, and Y is a dimensionless geometry factor that is dependent on the geometry of the crack, the geometry of the part, and the loading configuration.
The values Y and a are dependent on geometry, so for a specified crack and part geometry, the stress intensity factor is proportional to applied stress. Therefore, we can define the following:
| Maximum stress intensity: | Kmax = Y σmax√πa |
| Minimum stress intensity: | Kmin = Y σmin√πa |
| Stress intensity range: | ΔK = Kmax − Kmin |
| Stress ratio (R-ratio): |
|
Note that if the definitions for maximum and minimum stress intensity are substituted into the definition for the stress intensity range, a new, useful definition for stress intensity range can be obtained:
Another useful relationship can be derived by combining the equations for stress intensity range and R-ratio:
Looking for Fracture Calculators?
We have a few to choose from:
Overview of Crack Growth
When a cyclic load is applied to a material, the stress intensity range is calculated as discussed in the previous section:
A fluctuating stress intensity drives the crack to grow at some rate. When a stress intensity range ΔK is applied to a material for some number of cycles ΔN, this drives the crack to grow in length by a specific amount Δa. The growth rate of the crack at a specific stress intensity range is then given by the ratio Δa/ΔN. In continuous form, the crack growth rate is given by the derivative da/dN.
The crack growth rate in a material takes the form shown in the figure below. The curve in this figure is for an example material -- the actual growth rate varies between materials.
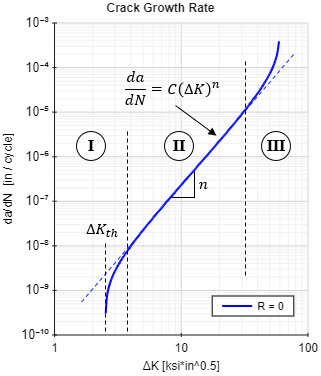
In this figure, the growth rate and the stress intensity range are plotted on a log-log scale. On a log-log plot, there is typically a straight-line region of da/dN over a range of ΔK values. This straight-line region is shown in the figure within region II, and it is defined by the Paris curve:
where C is an intercept constant and n is the slope on a log-log scale. The value n is dimensionless, but C has units of either (in/cycle)/(ksi√in )n or (mm/cycle)/(MPa√m )n. Note that the units of C are dependent on the value of n.
There are typically tails at the upper and lower ends of the growth rate curve. The tail at the lower end for small values of ΔK (region I) approaches a vertical asymptote called the fatigue crack growth threshold, ΔKth. Crack growth does not typically occur for stress intensity ranges below the threshold.
The tail at the upper end of the curve for large values of ΔK (region III) also approaches a vertical asymptote. When the stress intensity ratio R is equal to 0, corresponding to zero-to-tension loading, the vertical asymptote at the upper range of the curve is the critical stress intensity for the material. Recall that for thick sections, this critical stress intensity is the plane-strain fracture toughness. This upper tail in the high ΔK region signifies accelerating crack growth. Cracks in this region grow in a rapid and unstable manner until failure occurs.
Stress Ratio Effect on Crack Growth Rate
As the stress ratio R is increased, the crack growth rate in a material is also increased, and vice versa. This effect is demonstrated by the crack growth data below for 7075-T6 Aluminum Alloy Sheet, taken from MIL-HDBK-5J.
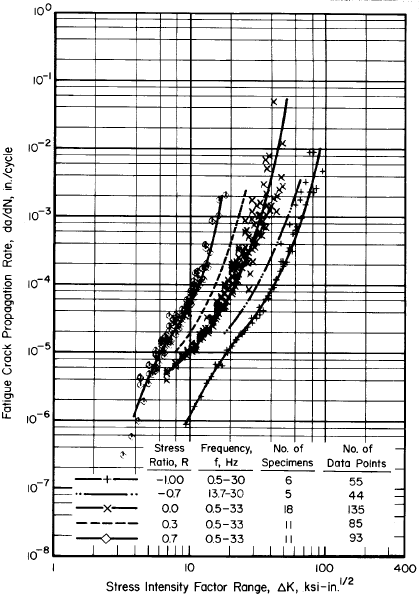
In the data above, crack growth curves are shown for values of stress ratio R ranging from -1 (fully reversing load) to +0.7. It can be seen that increasing R has the effect of shifting the crack growth rate up, but it does not affect the slope of the growth rate curve. Recall the Paris equation which defines the straight-line region of the crack growth curve:
In this equation, C is the intercept and n is the slope on a log-log scale. Because the stress ratio does not affect the slope of crack growth rate, R has no effect on n. However, because the stress ratio shifts the crack growth rate curve vertically, it does affect the intercept constant C.
Looking for Fracture Calculators?
We have a few to choose from:
Crack Growth Relationships
Many relationships have been developed for characterizing fatigue crack growth rate curves in materials. Among the most common are the Paris equation, the Walker equation, and the NASGRO equation.
Paris Equation
The Paris equation defines the straight-line region of crack growth:
Note that the Paris equation does not account for the stress ratio R. Because the crack growth rate in a material is dependent on the stress ratio, if the Paris equation is to be used for a non-zero stress ratio then an appropriate value of C will need to be used for the stress ratio R of interest.
Walker Equation
The Walker equation is a generalization of the Paris equation to account for the effect of stress ratio R on crack growth rate. The Walker equation takes the following form:
where R is the stress ratio, ΔK is the stress intensity range, and n is the slope on a log-log scale. The value γ is a material constant that indicates how strongly the stress ratio R affects crack growth rate in the material. The value C0 is the intercept constant C for the case where stress ratio R = 0.
Equivalent Zero-to-Tension Stress Intensity Ratio
The Walker equation can be rewritten as:
The equation above is of the same form as the Paris equation, except that the value C0 is used for the intercept constant at a stress ratio R = 0, and a value ΔK is used which accounts for the effect of the stress ratio R. The value ΔK is called the equivalent zero-to-tension stress intensity ratio, and it is the equivalent zero-to-tension (i.e., R = 0) stress intensity ratio that causes the same crack growth rate as the actual stress intensity ratio ΔK. The equivalent zero-to-tension stress intensity ratio is defined as:
Intercept Constant
The Walker equation can be rewritten in the form:
This form is similar to the Paris form of the equation, with the exception that the intercept constant C is a function of stress ratio R. Using this form of the equation it can be seen that the intercept constant C can be defined as:
Effect of Gamma
The γ term in the Walker equation is a material constant that indicates how strongly the stress ratio R affects crack growth rate in the material. According to Dowling, many metals have a typical γ value around 0.5, but the value can vary anywhere from around 0.3 to almost 1.0.
The figure below shows crack growth rates in an example material for various stress ratios R and for various γ values. The plots correspond to γ values of 0, 0.5, and 0.8, respectively. It can be seen in the plots that for a γ value of 0, the value of stress ratio R has a very strong effect on the crack growth rate. As γ for the material increases, the effect of the stress ratio R grows weaker. For a γ value of 0.8 as shown, the stress ratio R has very little effect on the crack growth rate.
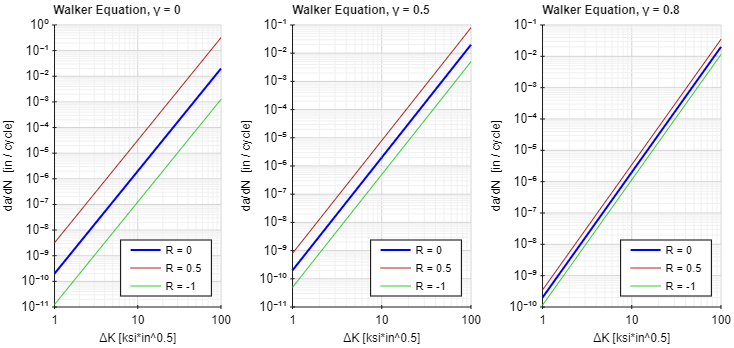
It should be noted that the value of γ for a material can be dependent on whether the stress ratio R is positive or negative. When the stress ratio R is negative, there is a compressive component to the loading. In more brittle materials, compressive loading tends to not contribute significantly to crack growth. Therefore, the value of γ for brittle materials may be closer to 0 for R < 0 which would tend to slow the rate of crack growth for the compressive portion of the loading. However, in more ductile materials, compressive loading does tend to contribute to crack growth and so the value of γ for R < 0 may be similar to the value of γ for R ≥ 0. Note that this is just a general trend, and specific values of γ will be dependent on the material.
NASGRO Equation
The NASGRO equation is the most general of the crack growth equations. It accounts for stress ratio R, crack closure, and the tails at the upper and lower ends of growth rate curve. The NASGRO equation is shown below:
where R is the stress ratio, f is the Newman crack closure function, ΔK is the stress intensity range, C0 is the intercept constant C for the case where stress ratio R = 0, and n is the slope on a log-log scale. The value Kmax is the maximum stress intensity in the range ΔK, and ΔKth is the threshold stress intensity range at the stress ratio R under consideration. The value Kc is the critical stress intensity; for thick sections this value could be the plane-strain fracture toughness, but it could also be the critical stress intensity for the specific section thickness.
The values p and q are empirical coefficients that determine the curvature of the growth rate curve in the tail regions. Their values are selected to fit the growth rate curve to experimental data. The coefficient p controls the curve in the low growth rate (threshold) region, and q controls the curve in the high growth rate region.
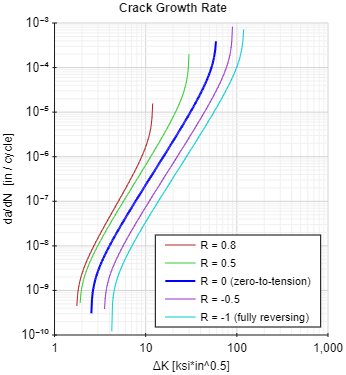
The crack growth rate for an example material is shown below using the NASGRO equation.
Looking for Fracture Calculators?
We have a few to choose from:
Failure Criteria
As a crack grows, the stress intensity factor at the crack tip increases. Failure occurs once the stress intensity factor exceeds the critical stress intensity Kc of the material. For thick sections the value of Kc could be the plane-strain fracture toughness, but it could also be the critical stress intensity for the specific section thickness.
In the case of a cyclic applied stress, the stress intensity factor should be calculated using the maximum stress value in the stress range. This maximum stress intensity factor, Kmax, should be compared to the Kc to determine failure.
There are other criteria that could be used in addition to the stress intensity criteria to determine failure of the part. For example, checking for yielding across the uncracked section is common. In this case, the maximum applied stress is typically compared to the flow stress, σf, which is the average of the yield strength and the ultimate strength:
Life Prediction
The lifetime of a cracked part is typically expressed as the number of cycles that it takes to grow the crack from some initial condition to a critical condition. Closed form expressions to determine the lifetime of a cracked part do exist for simple cases. However, in general it is necessary to use numerical methods to determine the expected lifetime of a part. In this case, the crack growth is simulated using the general procedure shown below:
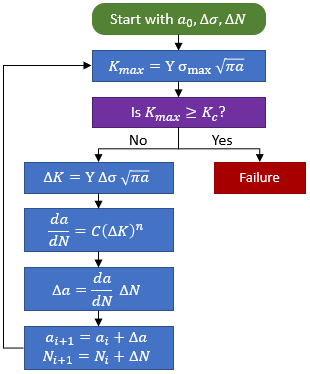
In the procedure shown above, the initial crack size is known or assumed (see this page for a discussion on determining the initial crack size). The applied stress range Δσ is also known, and a step size for number of cycles, ΔN, is selected.
The first step is to calculate the stress intensity factor for the current crack size at the maximum applied stress in the stress range:
Check for the failure condition, as discussed in the previous section. If Kmax exceeds the material's critical stress intensity Kc, then the failure condition is met and the simulation is stopped. Otherwise, the simulation is continued to determine the crack growth for the current iteration.
Calculate the stress intensity range:
Using the calculated stress intensity range, one of the crack growth relationships (for instance, the NASGRO equation) can be used to calculate the crack growth rate da/dN. Use this crack growth rate together with the cycle step size to determine the incremental growth of the crack for this iteration:
The new crack size is then:
This new crack size is then used for the next iteration of the simulation. The crack is grown iteratively until the failure condition is met. Once failure occurs, the total number of cycles that it took to grow the crack to the critical size becomes the predicted life of the part.
Factor of Safety
There is uncertainty in the initial size of the crack (what size crack can be detected), the stress levels experienced during operation, and the crack growth rate properties of the material.
The factor of safety can be calculated with respect to stress (considering maximum applied stress as compared to the residual strength remaining in the part), or with respect to the number of cycles to failure. The factor of safety with respect to cycles to failure is:
where Nf is the expected number of cycles to failure and Ns is the number of cycles that the part will experience in service.
In the case that the number of cycles experienced during service is too large as compared to the expected number of cycles to failure, periodic inspections may be required to ensure that cracks do not grow to the point that they become critical. The inspection period should be chosen at some fraction of the expected time to failure. Cracks detected during inspection may be repaired. If repair is impractical, then crack growth analysis should be performed to determine the expected cycles to grow the detected crack to failure. The results of the analysis may indicate that part replacement is necessary.
Some systems may be designed to allow for some crack growth before repair and replacement. In this case, fatigue crack growth analysis is key to safe operation of the system. This approach to allowing and accounting for a safe level of crack growth during the operation of the system is referred to as damage-tolerant design.
PDH Classroom offers a continuing education course based on this fatigue crack growth reference page. This course can be used to fulfill PDH credit requirements for maintaining your PE license.
Now that you've read this reference page, earn credit for it!
References
- AFRL-VA-WP-TR-2003-3002, "USAF Damage Tolerant Design Handbook: Guidelines for the Analysis and Design of Damage Tolerant Aircraft Structures," 2002
- API 579-1 / ASME FFS-1, "Fitness-For-Service," The American Petroleum Institute and The American Society of Mechanical Engineers, 2007
- Anderson, T.L., "Fracture Mechanics: Fundamentals and Applications," 3rd Edition
- Dowling, Norman E., "Mechanical Behavior of Materials: Engineering Methods for Deformation, Fracture, and Fatigue," 3rd Edition
- Liu, Alan F., "Structural Life Assessment Methods," ASM International, 1998
- MIL-HDBK-5J, "Metallic Materials and Elements for Aerospace Vehicle Structures," Department of Defense Handbook, 2003
- NASA-STD-5009, "Nondestructive Evaluation Requirements for Fracture-Critical Metallic Components," 2008
- Naval Sea Systems Command, "Fracture Toughness Review Process for Metals in Critical Non-Nuclear Shipboard Applications," 1998
- Sanford, R.J., "Principles of Fracture Mechanics," 1st Edition
