Fatigue Crack Growth Instructions
This page provides instructions on the use of the Fatigue Crack Growth calculator. This calculator allows for fatigue crack growth analysis of a cracked part. Cyclic loading is applied in the form of a stress history. The crack growth rate is calculated at each stress cycle, and the crack is grown until failure.
Reference and Validation
Reference: A general description of the theory and the methodology used can be found here.
Validation: This calculator has been validated against known solutions to numerous example problems. Documentation of the validation can be found here.
Inputs
In this section, all of the relevant details pertaining to the analysis are entered.
Crack Geometry & Material Properties
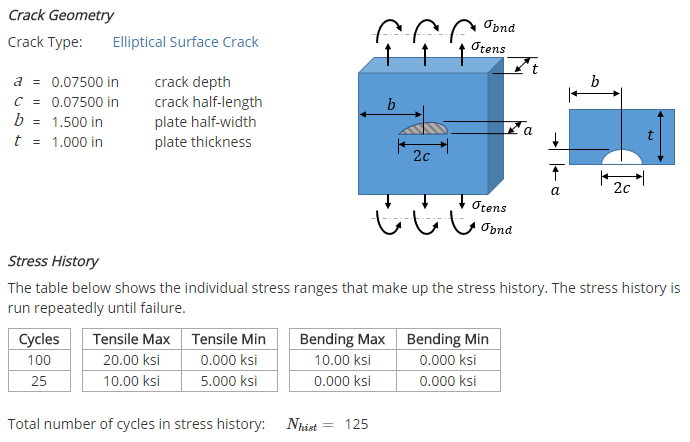
The first section of the input form is shown below. The required inputs in this section relate to the crack geometry, plate geometry, and plate material. In this case, an elliptical surface crack is specified at the center of a plate. The material assigned to the plate is an example material, "Fracture Material 1."
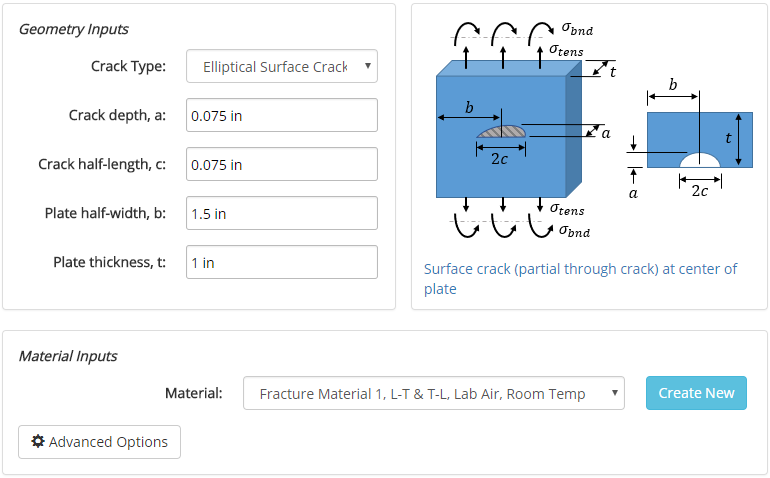
Fracture materials can be created within the fracture materials database. Once materials are created, they will show up in the drop-down menus on the input form.
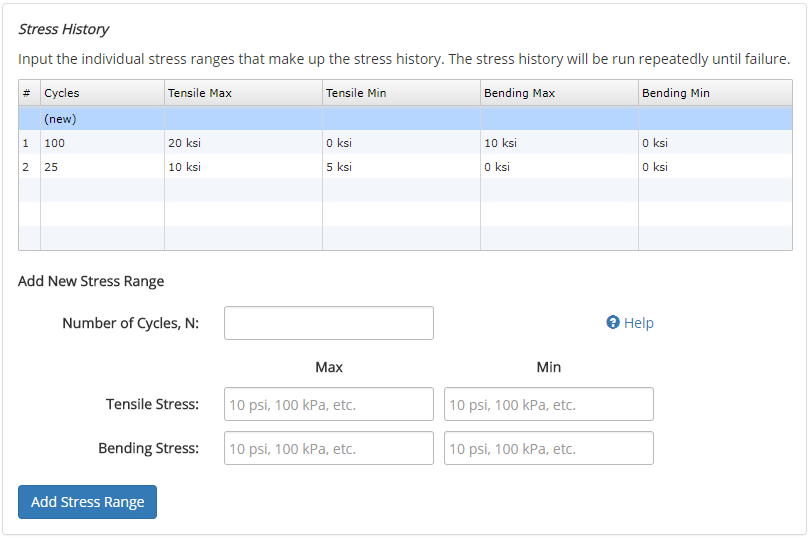
Stress History
The second section of the input form allows for the specification of a stress history that is applied to the part. The stress history is composed of one or more stress ranges. A stress range is defined by a maximum and minimum value of tensile stress, a maximum and minimum value of bending stress, and a number of cycles associated with the range. A single cycle of the stress range alternates the stress from the minimum tensile and bending stresses to the maximum tensile and bending stresses.
The stress history is run repeatedly until failure. The number of cycles that it took to fail the part are reported along with the number of times the stress history was repeated.
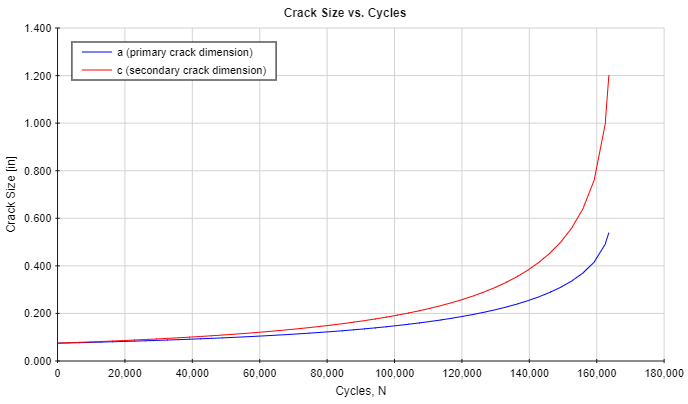
An example stress history is shown below which is composed of two stress ranges. The first stress range is 100 cycles where the tensile stress alternates between 0 to 20 ksi and the bending stress alternates between 0 to 10 ksi. The second stress range is 25 cycles where the tensile stress alternates between 5 to 10 ksi. There are 125 total cycles in the stress history. If the part doesn't fail after the stress history is run all the way through, then the history will continue to be run until failure occurs. In this example problem, the stress history was run 1,309 times before failure occurred (for a total of 163,600 cycles).
Results
After the analysis is solved, results are displayed in multiple tabs. Each results tab is discussed in the following sections.
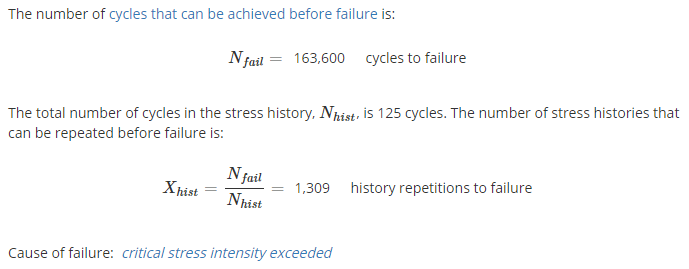
Results Summary
A summary of the results is provided to give the number of cycles that can be achieved before failure, the number of stress histories that were repeated before failure, and the cause of failure. The possible causes of failure are:
- critical stress intensity exceeded -- the stress intensity in the part has exceeded the critical stress intensity (fracture toughness) of the material
- dimensions exceeded -- the crack size has exceeded the boundaries of the part
A plot of the crack size as a function of cycles is also provided:
Crack Geometry & Stress History
After the analysis is solved, details on the crack geometry and the stress history are displayed. The way in which these properties are used in the analysis is described in more detail in the Reference section.
Material Properties
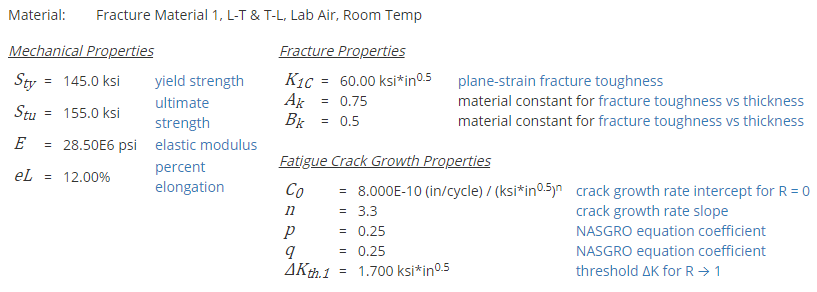
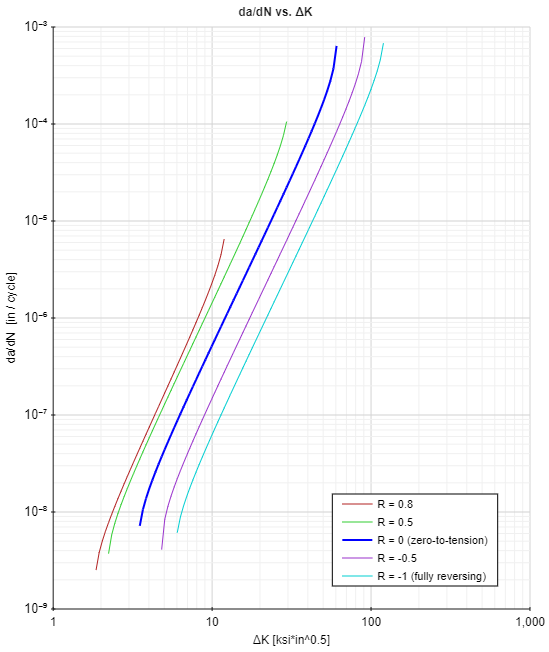
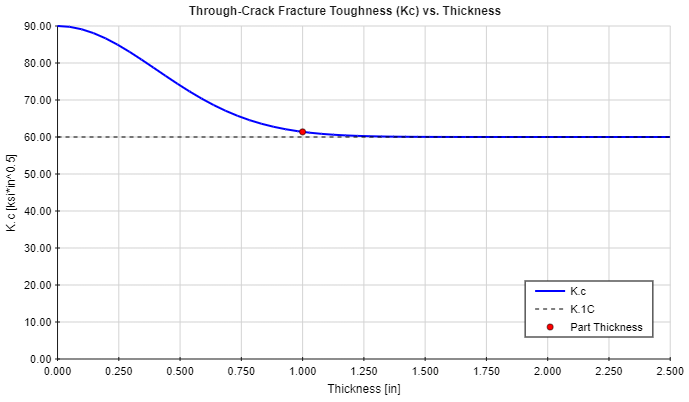
An overview of the mechanical, fracture, and fatigue crack growth properties for the selected material is provided, as shown below. A plot of the crack growth rate (da/dN) curve is also provided, as well as the fracture toughness versus thickness curve for the selected material.
Results Details
The results details section is long, but the highlights are provided here. The primary details of interest include the number of cycles that can be achieved before failure, the number of stress histories that were repeated before failure, and the cause of failure. The possible causes of failure are:
- critical stress intensity exceeded -- the stress intensity in the part has exceeded the critical stress intensity (fracture toughness) of the material
- dimensions exceeded -- the crack size has exceeded the boundaries of the part
A plot of the crack size as a function of cycles is also provided:
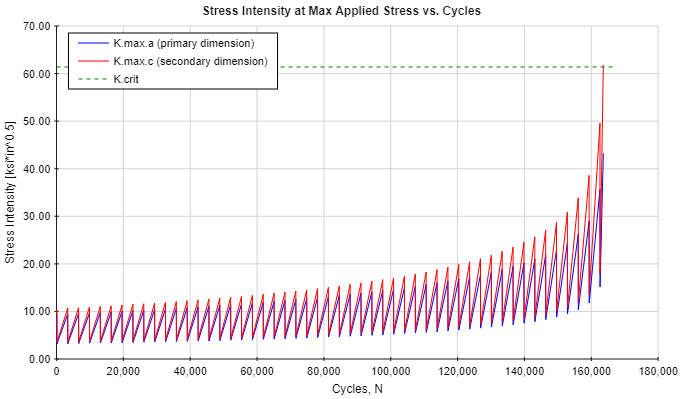
A plot of the stress intensity as a function of cycles is provided, as shown below. In this plot, the reported stress intensities are those that occur at the maximum value of applied stress in the stress range (recall that the stress range is defined by a maximum and a minimum stress value).
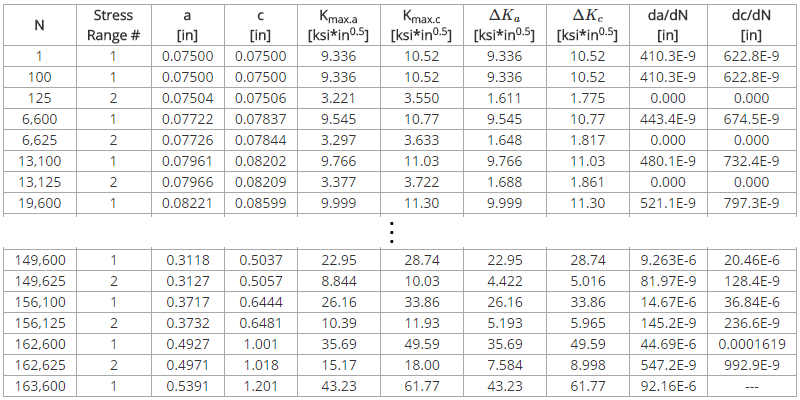
Simulation Details
A table is provided which lists an abbreviated sampling of the crack growth results. The full results table will typically contain thousands of rows, so showing the full results table is impractical. However, the abbreviated results table is still helpful for spot checking.