Beam Analysis Validation
This section details the validation for the Beam calculator. Several examples are worked through to determine expected results such as deflections, forces, and stresses. These expected results are then compared to the actual output of the calculator.
Simply-Supported Beam, Intermediate Load
The standard beam equations for a simply-supported beam with an intermediate load are given below:
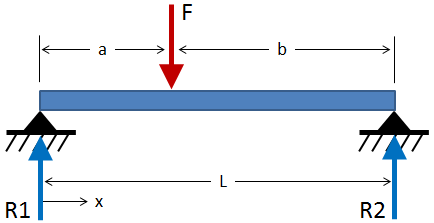
| Max Deflection: | $$ \delta_{max} = {P b (L^2 - b^2)^{3/2} \over 9 \sqrt{3} LEI} $$ | @ \( x = \sqrt{ {L^2 - b^2} \over 3 } \) |
| Reaction R1: | $$ R_1 = {Fb \over L} $$ | |
| Reaction R2: | $$ R_2 = {Fa \over L} $$ | |
| Shear: | $$ V_1 = +{Fb \over L},~~ V_2 = -{Fa \over L} $$ | |
| Moment: | $$ M_{max} = +{Fab \over L} $$ | @ x = a |
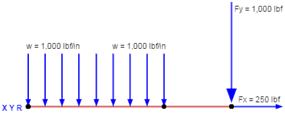
For the validation case, an Aluminum 6061-T6 beam with a 1 inch diameter circular cross-section and a length of 10 inches will be loaded at 1000 lbf at a location of a = 3 in. The inputs are:
For the given inputs, the expected results are:
| Max Deflection: | \( \delta_{max} = 0.03365 \text{ in} \) | @ x = 4.123 in |
| R1: | \( R_1 = +700 \text{ lbf,}~~ V_1 = +700 \text{ lbf} \) | |
| R2: | \( R_2 = +300 \text{ lbf,}~~ V_2 = -300 \text{ lbf} \) | |
| Moment: | \( M_{max} = +2100 \text{ in-lbf} \) | @ x = 3 in |
Comparison With Calculator
Free Body Diagram
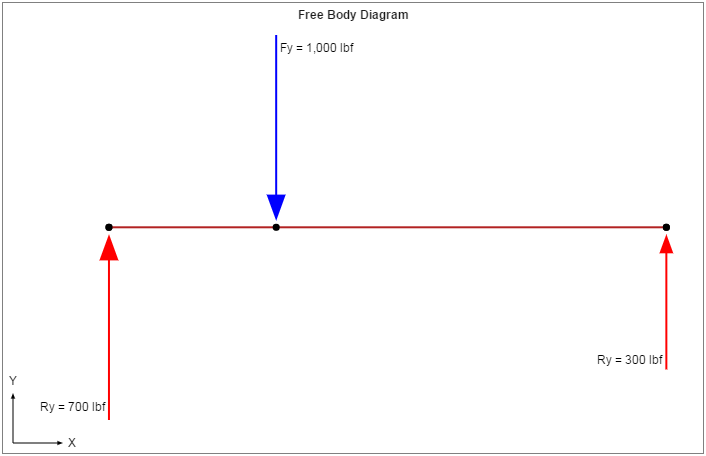
The Free Body Diagram (FBD) is shown below. From the FBD it can be seen that the forces balance and the beam is in static equilibrium.
Deflection & Slope
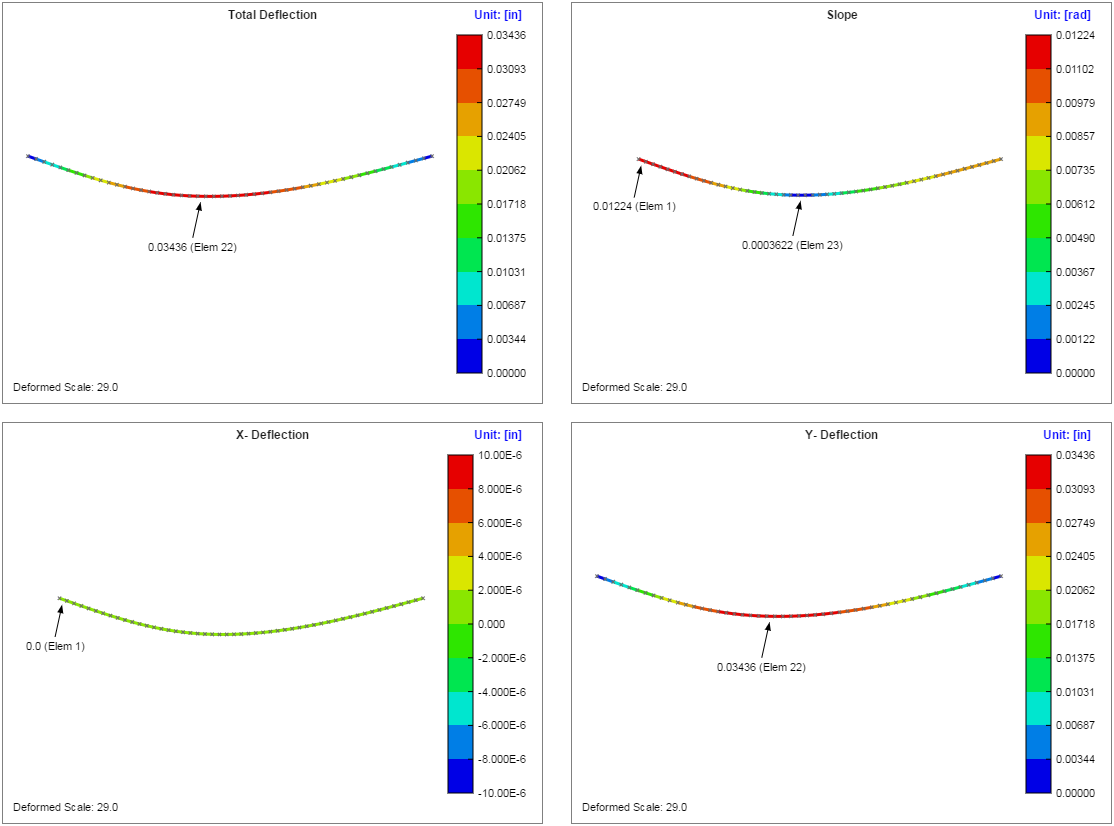
A screenshot of the results table giving the maximum deflection and slope is shown below. While the results aren't an exact match to the expected values, the error is minimal. The maximum reported slope of 0.01224 rad does match the expected results. However, the reported maximum deflection does not exactly match, with an error of 2.11% (0.03436 in versus the ideal 0.03365 in).

The deflection plots are shown below. From these plots it can be seen that a maximum deflection of 0.03436 inches occurs toward the left-center of the beam, and the maximum slope of 0.01224 radians occurs at the left support.
Shear-Moment Diagram
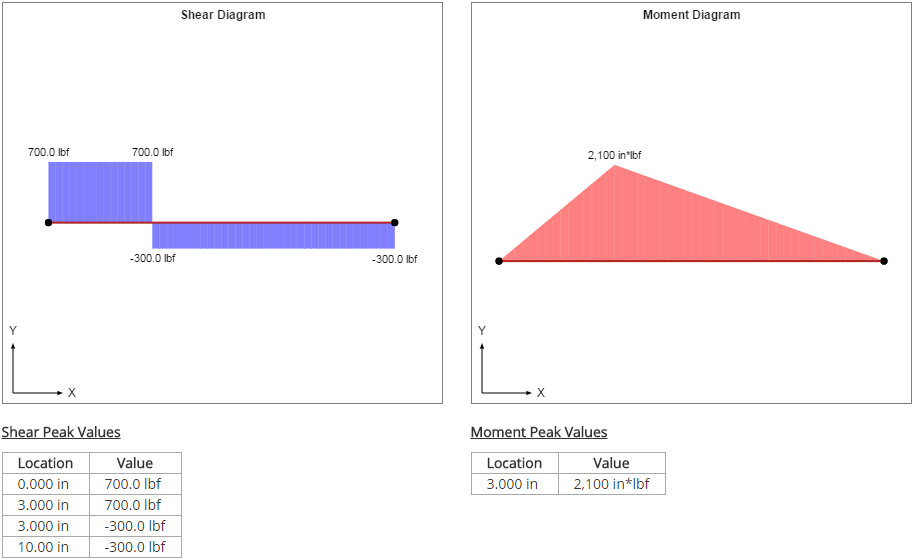
The shear-moment diagram for the beam is shown below. This diagram is what would be expected for the current case. A constant shear force of +700 lbf exists from the left end of the beam until the location of the applied force, after which the shear force is -300 lbf until the right end of the beam. The moment increases linearly from 0 in-lbf at the left end of the beam to its maximum value of +2,100 in-lbf at the location of the applied force. It then decreases linearly to 0 in-lbf at the right end of the beam.
Stresses
There are three points of interest for validating stresses. Before calculating stress, the forces at these points need to be determined. Note that there is a discontinuity in the shear force at the point x = a. There will be a node at this point, and this node will be shared by two elements. The element on the left will have a shear force of \( F_{sh} = R1 \), and the element on the right will have a shear force \( F_{sh} = R2 \). However, for the purposes of this validation exercise, the maximum of these shear forces will be used.
| Axial (lbf) | Shear (lbf) | Moment (in-lbf) | |
|---|---|---|---|
| Forces @ x = 0: | $$ F_{ax} = 0 $$ | $$ F_{sh} = R1 = 700 $$ | $$ M = 0 $$ |
| Forces @ x = a: | $$ F_{ax} = 0 $$ | $$ F_{sh} = \max(R1,R2) = 700 $$ | $$ M = M_{max} = 2100 $$ |
| Forces @ x = L: | $$ F_{ax} = 0 $$ | $$ F_{sh} = R2 = 300 $$ | $$ M = 0 $$ |
The stresses are calculated using the following equations:
| Axial Stress | Shear Stress | Bending Stress | Von Mises Stress |
|---|---|---|---|
| $$ \sigma_{ax} = {F_{ax} \over A} $$ | $$ \tau_{sh} = {F_{sh} \over A} $$ | $$ \sigma_{b} = {Mc \over I} $$ | $$ \sigma_{vm} = \sqrt{ (\sigma_{ax} + \sigma_{b})^2 + 3\tau_{sh}^2 } $$ |
Based on the forces at each point and the equations above, the expected stresses at the points of interest are:
| Tensile (psi) | Shear (psi) | Bending (psi) | Von Mises (psi) | |
|---|---|---|---|---|
| Stress @ x = 0: | $$ \sigma_{ax} = 0 $$ | $$ \tau_{sh} = 891 $$ | $$ \sigma_{b} = 0 $$ | $$ \sigma_{vm} = 1544 $$ |
| Stress @ x = a: | $$ \sigma_{ax} = 0 $$ | $$ \tau_{sh} = 891 $$ | $$ \sigma_{b} = 21390 $$ | $$ \sigma_{vm} = 21446 $$ |
| Stress @ x = L: | $$ \sigma_{ax} = 0 $$ | $$ \tau_{sh} = 382 $$ | $$ \sigma_{b} = 0 $$ | $$ \sigma_{vm} = 662 $$ |
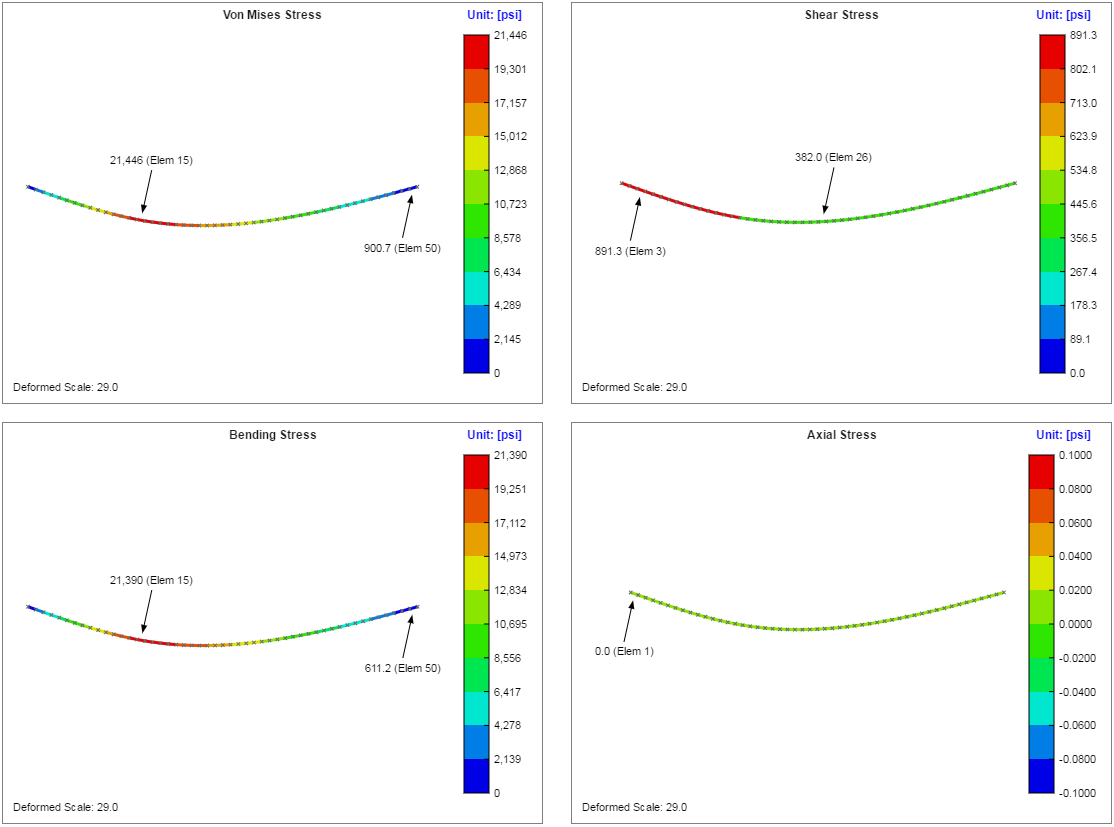
The stress plots are shown below. It can be seen that these plots agree with the stresses calculated above.
