2D FEA Validation
This section details the validation for the 2D FEA calculator. Several examples are worked through to determine expected results such as deflections, forces, and stresses. These expected results are then compared to the actual output of the 2D FEA.
Cantilever Beam, Uniform Distributed Force
The standard beam equations for a cantilever beam loaded with a uniform distributed force are given below:
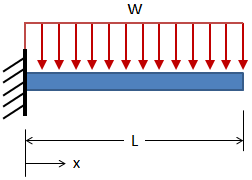
| Max Deflection: | $$ \delta_{max} = {w L^4 \over 8EI} $$ | @ x = L |
| Max Slope: | $$ \theta_{max} = {w L^3 \over 6EI} $$ | @ x = L |
| Max Shear: | $$ V_{max} = +wL $$ | @ x = 0 |
| Max Moment: | $$ M_{max} = -{w L^2 \over 2 } $$ | @ x = 0 |
For the validation case, an Aluminum 6061-T6 beam with a 1 inch diameter circular cross-section and a length of 10 inches will be loaded with a uniform distributed force of 100 lbf/in. Since the beam is 10 inches long, the total force applied to the beam is 1000 lbf. The inputs are:
For the given inputs, the expected results are:
| Max Deflection: | \( \delta_{max} = 0.2547 \text{ in} \) | @ x = L |
| Max Slope: | \( \theta_{max} = 0.03395 \text{ rad} \) | @ x = L |
| Max Shear: | \( V_{max} = +1000 \text{ lbf} \) | @ x = 0 |
| Max Moment: | \( M_{max} = -5000 \text{ in-lbf} \) | @ x = 0 |
The Free Body Diagram (FBD) is shown below. From the FBD it can be seen that the forces balance and the beam is in static equilibrium.
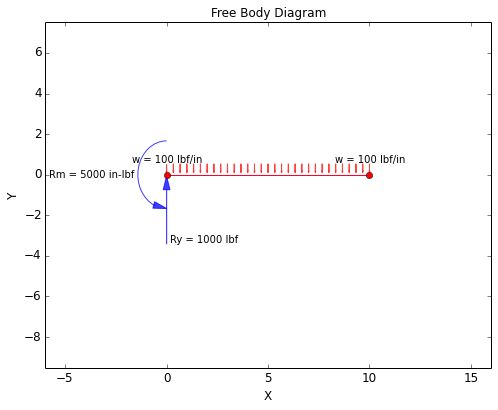
Since distributed forces are applied to the mesh by applying a force to each node (as opposed to the ideal continuum), the results are affected by mesh density. The results converge toward the ideal results as the mesh is refined.
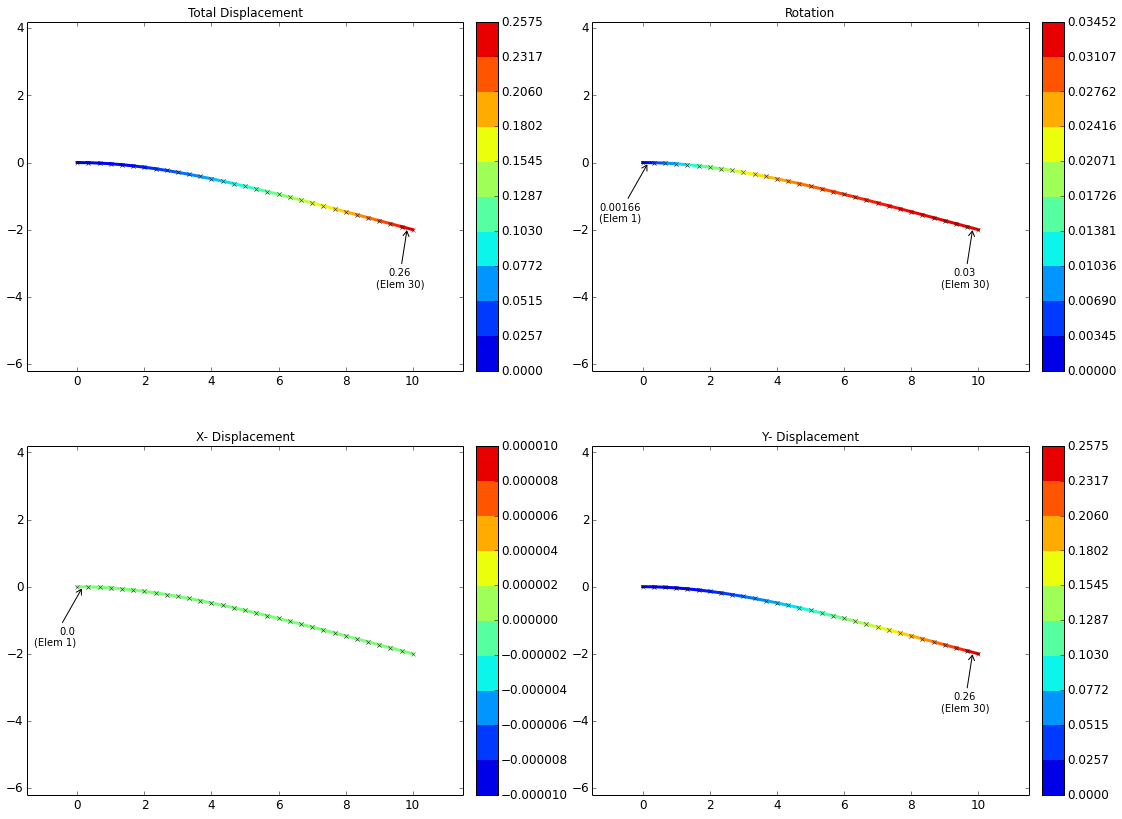
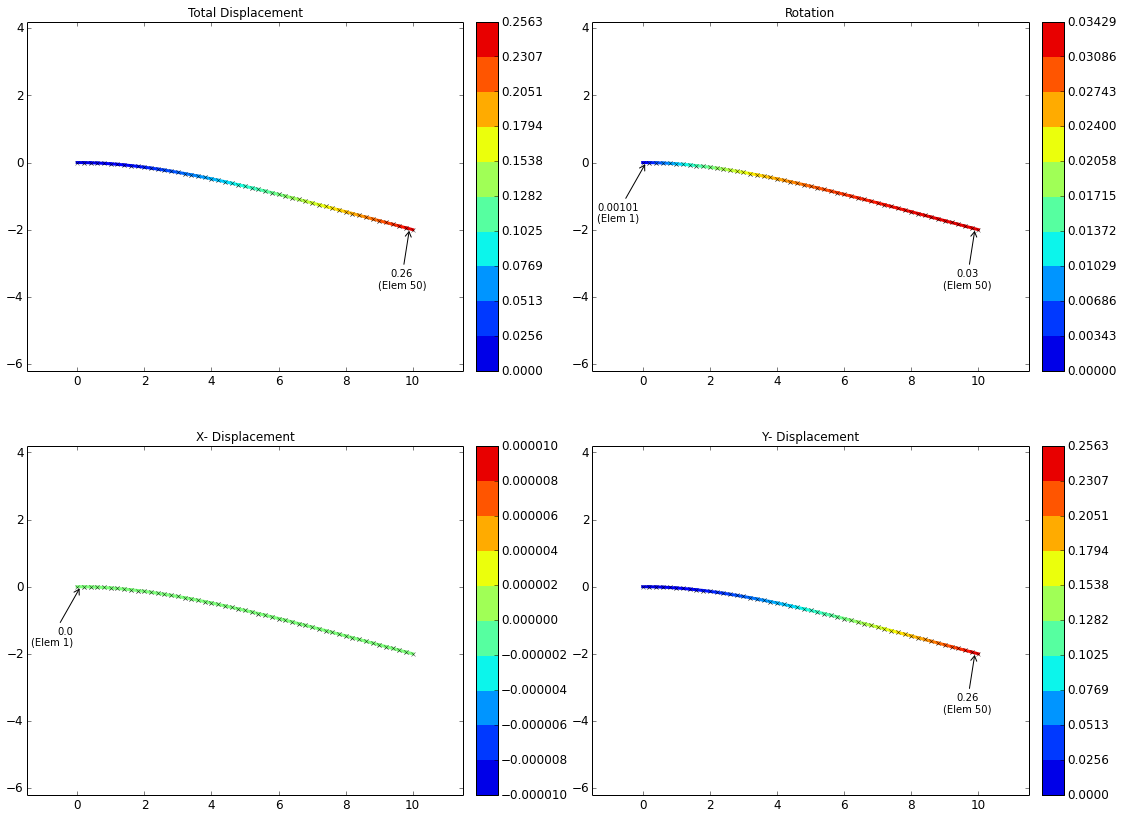
The ideal displacements as compared to the 2D FEA results for different mesh densities are given in the table below:
| Displacement @ x = L | Slope @ x = L | |
|---|---|---|
| Ideal: | 0.2547 in | 0.03395 rad |
| 30 Elements: | 0.2575 in (1.12% error) | 0.03452 rad (1.67% error) |
| 50 Elements: | 0.2563 in (0.65% error) | 0.03429 rad (0.99% error) |
The displacement plots for two different mesh densities are shown below:
Displacement Plots, 30 Elements in Mesh:
Displacement Plots, 50 Elements in Mesh:
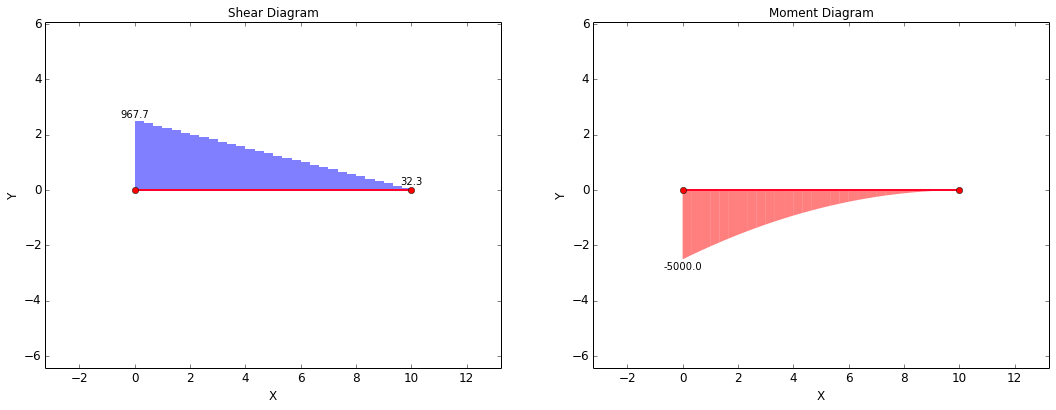
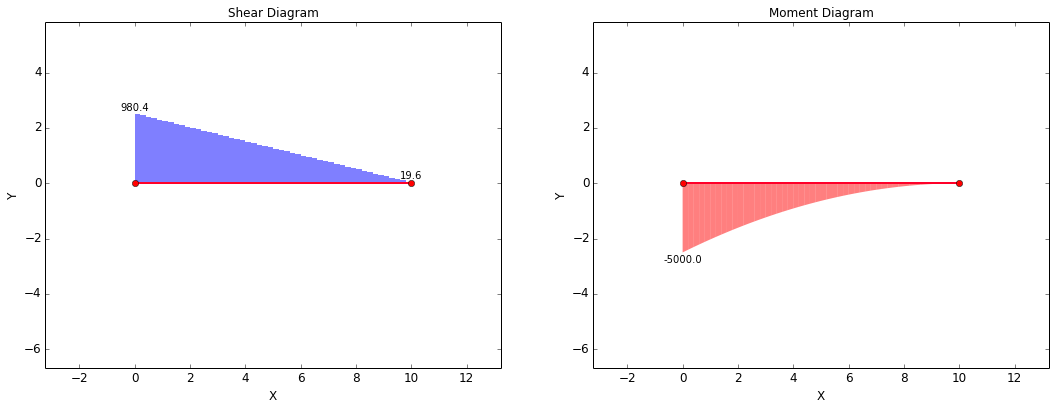
The shear-moment diagrams for the beam are shown below at varying mesh densities. In the ideal case, the peak shear force at x = 0 would be 1000 lbf and the peak moment at x = 0 would be 5000 in-lbf. However, since the results are affected by mesh density for distributed loads, the peak shear force at x = 0 in the diagram is not quite 1000 lbf. It should be noted that the peak shear force converges toward 1000 lbf as the mesh is refined.
The overall trends of the shear-moment diagrams are what would be expected. The shear force decreases linearly from the fixed end of the beam to the free end. The magnitude of the moment decreases parabolically from the fixed end of the beam to the free end.
Shear-Moment Diagram, 30 Elements in Mesh:
Shear-Moment Diagram, 50 Elements in Mesh:
The stresses will be validated at the fixed end of the beam. At this point, the ideal forces are:
| Axial (lbf) | Shear (lbf) | Moment (in-lbf) | |
|---|---|---|---|
| Forces @ x = 0: | $$ F_{ax} = 0 $$ | $$ F_{sh} = 1000 $$ | $$ M = 5000 $$ |
The stresses are calculated using the following equations:
| Axial Stress | Shear Stress | Bending Stress | Von Mises Stress |
|---|---|---|---|
| $$ \sigma_{ax} = {F_{ax} \over A} $$ | $$ \tau_{sh} = {F_{sh} \over A} $$ | $$ \sigma_{b} = {Mc \over I} $$ | $$ \sigma_{vm} = \sqrt{ (\sigma_{ax} + \sigma_{b})^2 + 3\tau_{sh}^2 } $$ |
Based on the equations above, the ideal and calculated stresses at the fixed end are:
| Tensile, \( \sigma_{ax} \) (psi) | Shear, \( \tau_{sh} \) (psi) | Bending, \( \sigma_{b} \) (psi) | Von Mises, \( \sigma_{vm} \) (psi) | |
|---|---|---|---|---|
| Ideal: | $$ 0 $$ | $$ 1273 $$ | $$ 50930 $$ | $$ 50977 $$ |
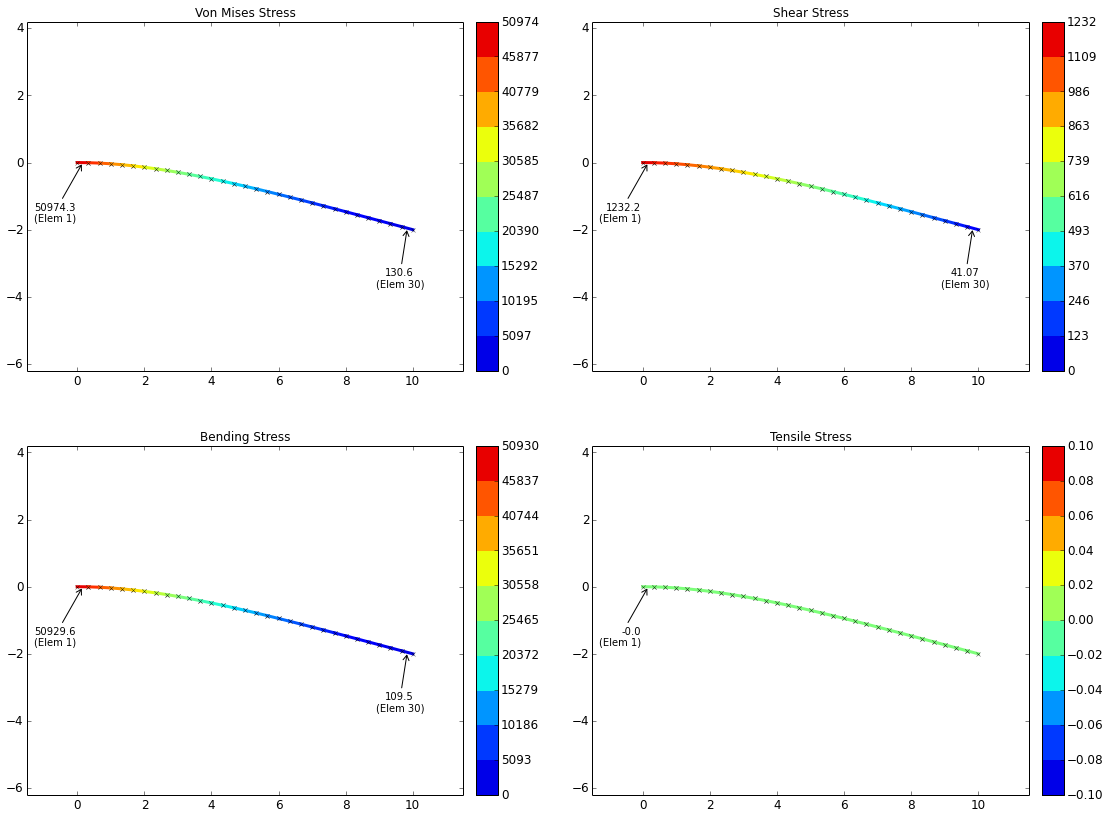
| 30 Elements: | $$ 0 \text{ (0.00% error)} $$ | $$ 1232 \text{ (3.24% error)} $$ | $$ 50930 \text{ (0.00% error)} $$ | $$ 50974 \text{ (0.01% error)} $$ |
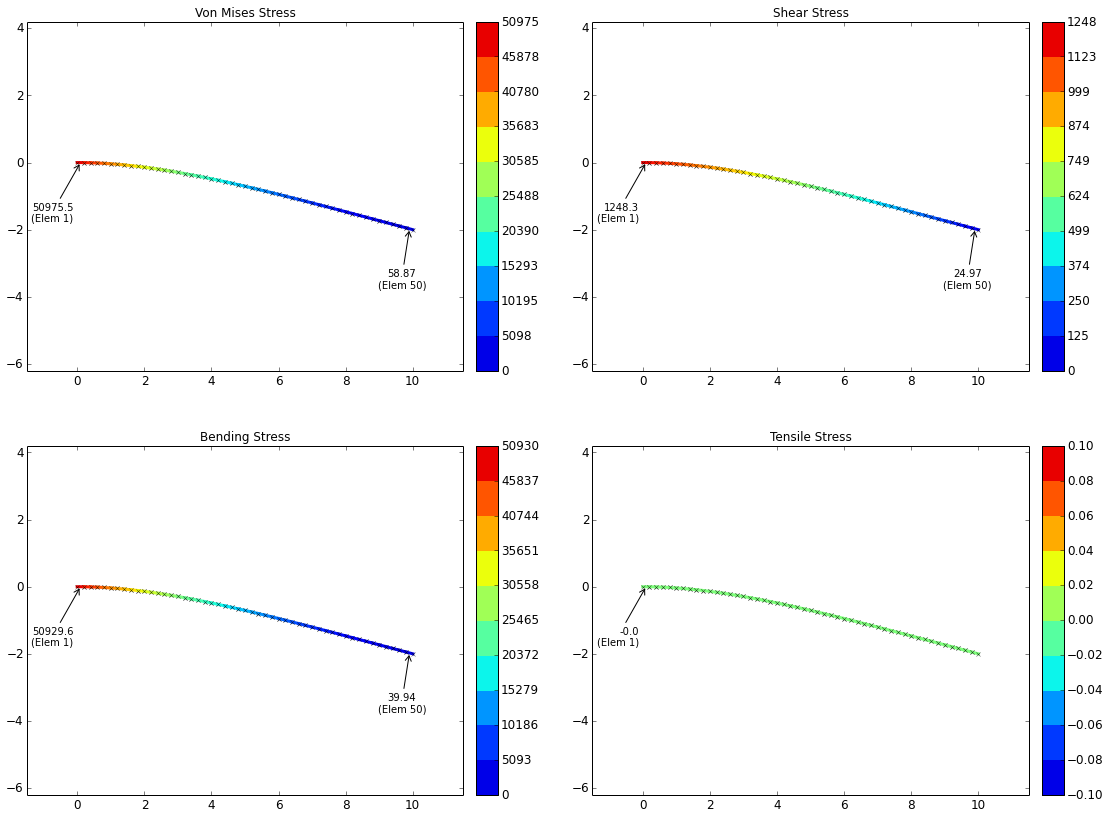
| 50 Elements: | $$ 0 \text{ (0.00% error)} $$ | $$ 1248 \text{ (1.98% error)} $$ | $$ 50930 \text{ (0.00% error)} $$ | $$ 50975 \text{ (0.00% error)} $$ |
The stress plots are shown below at varying mesh densities:
Stress Plots, 30 Elements in Mesh:
Stress Plots, 50 Elements in Mesh:
